
4.5 Distribution of Funds and Funded Institutions
BARD’s research grant guidelines do not require an equal allocation of the research budget between the two countries. The research teams enjoy the independence of deciding how to divide the awarded BARD research grant.
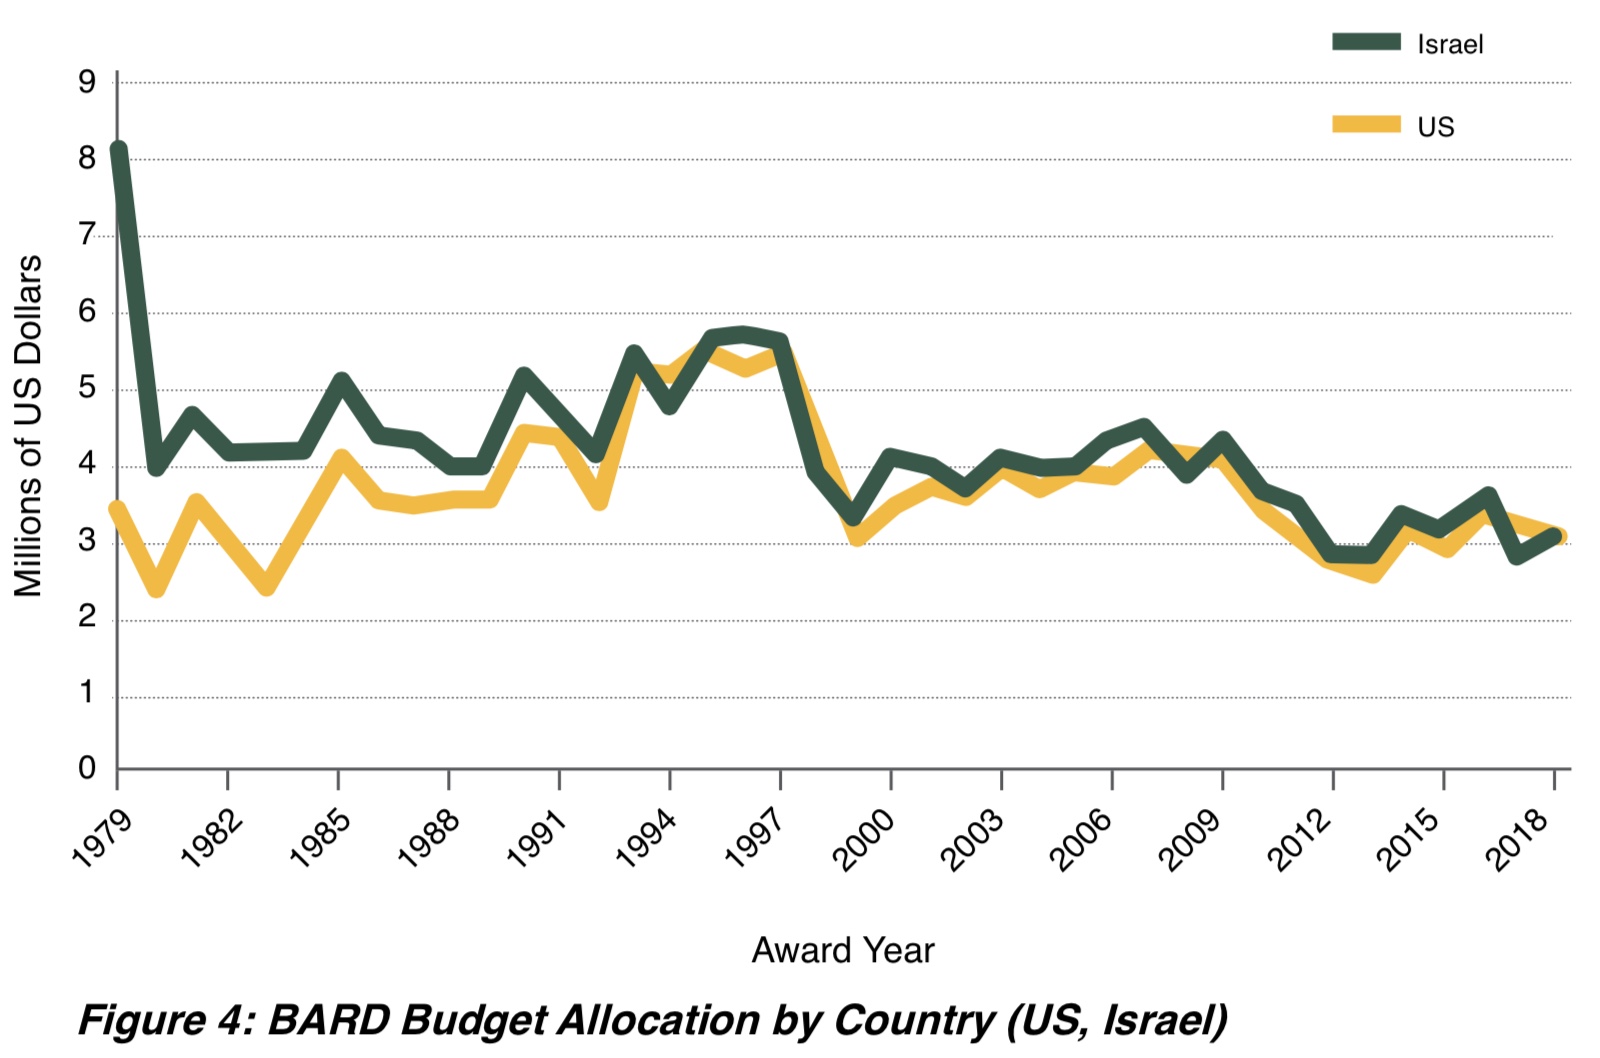
BARD’s research grant guidelines do not require an equal allocation of the research budget between the two countries. The research teams enjoy the independence of deciding how to divide the awarded BARD research grant. As can be seen in Figure 4, a larger share of the budget was allocated to the Israeli teams in the early years; however, for the last 20 years, the budget was split nearly evenly between the two countries. 1999 saw a steep plummet in total funding after both countries cut their annual budgetary supplement from $2.5 million to $500,000 each. Funding has further declined since 2008, as falling interest rates on the US dollar decreased the income from the endowment fund.
Funded Institutions
In the US, the majority (73%) of partners in BARD projects are scientists from state universities and land-grant colleges. The remainder are from the USDA-ARS (13%) and other private and public non-profit research institutions (14%). In Israel, almost 50% of the allocations go to research partners at the Agricultural Research Organization, Volcani Center (ARO). Another 23% goes to the Hebrew University of Jerusalem, with the remainder to other universities and non-profit research institutions. The full list of funded institutions can be found in Appendix C.
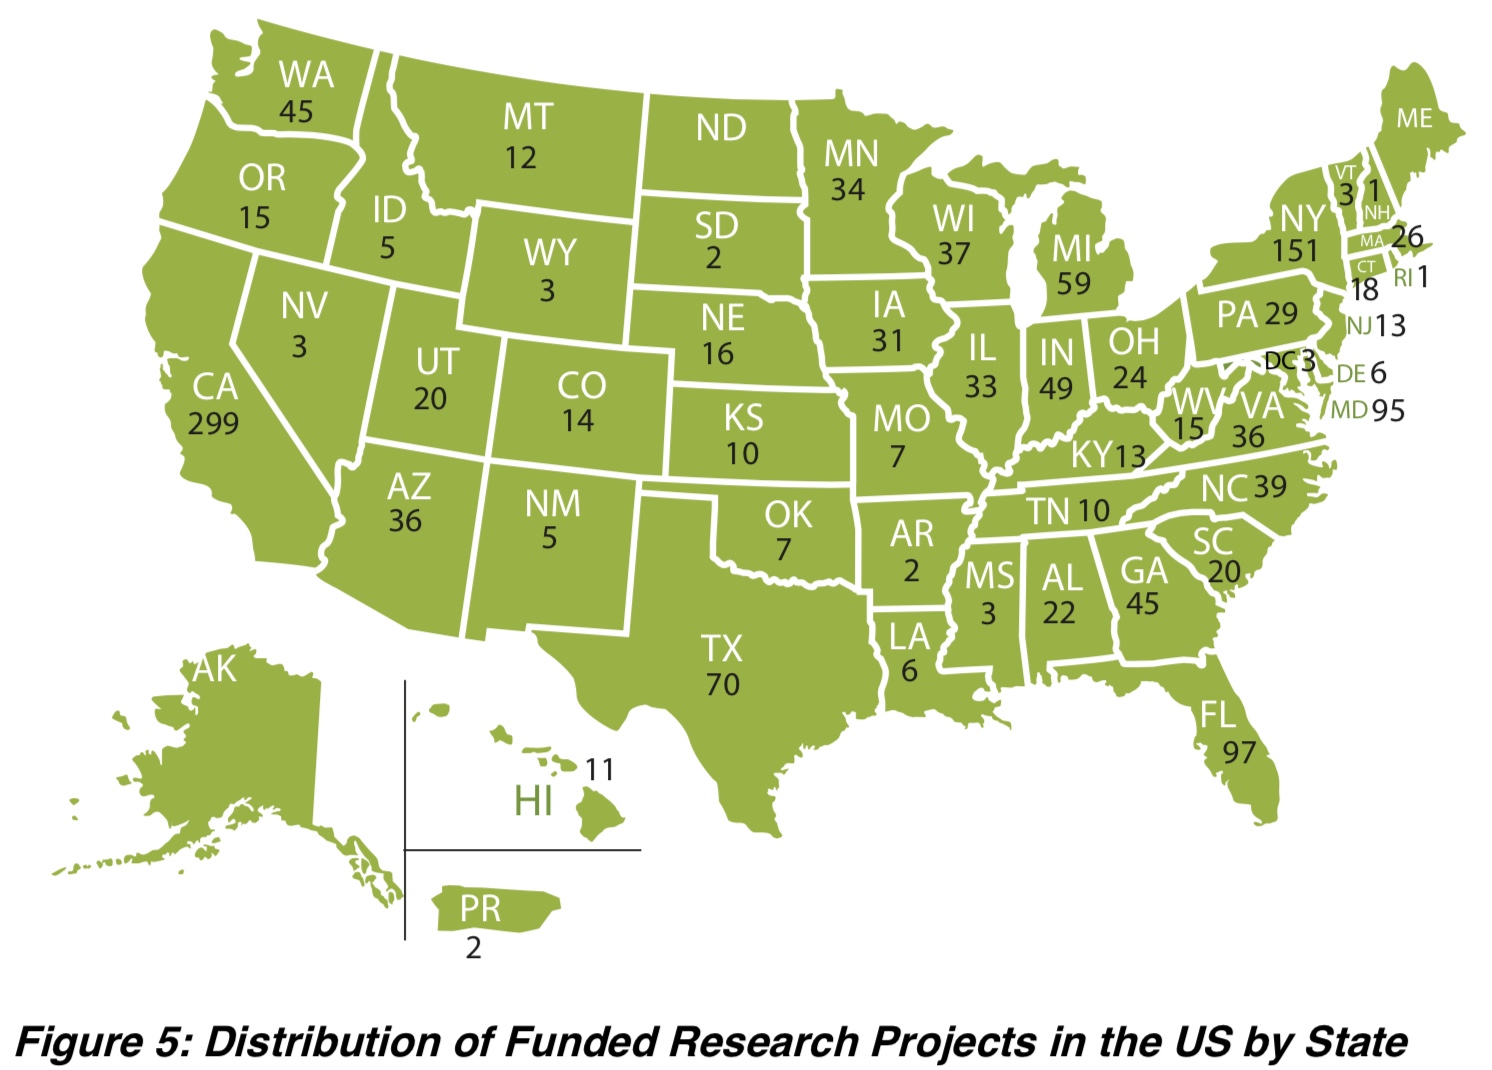
BARD has been successful in funding projects all over the United States, reaching 47 of the 50 states. BARD has yet to fund projects in North Dakota, Maine and Alaska (Figure 5).
The top funded research projects per state are California, New York, Florida, Maryland, Texas and Michigan. California received the highest proportion of funding for nearly 300 research projects, which constitute over 20% of the total number of projects. Over 11% of projects funded were granted to researchers in New York and over 7% to researchers in Florida, with 151 and 97 projects, respectively.
|
Table 2: BARD Allocation of Budget by Type of Expenditure(BARD Research Grant Program) |
|||
|
BUDGET (in US Dollars) |
|||
|
|
Israel |
U.S. |
Total |
|
Salaries |
79,187,537 47% |
83,686,590 57% |
162,874,127 52% |
|
Equipment |
10,744,918 6% |
3,359,184 2% |
14,104,102 4% |
|
Supplies |
44,587,745 27% |
32,641,627 22% |
77,229,372 24% |
|
Travel Abroad |
4,224,821 3% |
3,678,733 2% |
7,903,554 3% |
|
Overhead |
28,688,329 17% |
24,259,827 17% |
52,948,156 17% |
|
Total |
167,433,350 100% |
147,625,961 100% |
315,059,311 100% |
This table shows cumulative funding for the past 40 years and the funds’ distribution by budgetary item in each country. In both countries, approximately half of the funding is for personnel. The salaries shown here represent the payments for postdoctoral fellows, graduate students or laboratory technicians involved in the research project (BARD regulations strictly prohibit use of the funding to pay for Investigators’ salaries). Approximately one-quarter of the total budget in both countries covers supply procurement. Less than 10% of the budget is allocated to equipment. Overhead claims 17% of the total budget (BARD regulations limit the overhead costs to 20% of direct expenditure). The findings of this analysis show that the allocations by budget item in both countries are similar.