
5.2 The Results
We regard BARD’s funding of research projects as an investment and aim to quantify the returns on these investments by employing a set of key indicators. In order to measure the returns, we deducted the initial investment from the economic benefit attributed to BARD, arriving at the Net Present Value (NPV), which reflects the return.
Additionally, we calculate the Internal Rate of Return (IRR), which is the rate at which the NPV of a given project cash flow equals the present value of the initial investment. A high IRR is an indicator of a gainful project.
Another indicator is the Benefit-Cost Ratio (BCR), here calculated to reflect the ratio between the benefit attributed to BARD and the cost of the initial investment in 2018 dollar-terms. We note that typically, governments pay the costs of the foundational research, while benefits accrue to producers and consumers of farm products.[1]
Availability of relevant data is essential to conducting economic analyses. However, in certain cases, the data and price estimates of key parameters available to us were incomplete. To address this caveat, we presented baseline results along with a sensitivity analysis including low and high estimates of the benefit and attribution to BARD in different scenarios.
The distribution of projects across the 7 BARD topic panels was analyzed for all components of the report, including the awarded BARD projects, the projects reported on in the online survey, and the chosen case studies, as shown in Figure 6. With the exception of the Animal Production panel, the selection of case studies per panel corresponded to their proportional share within the full BARD portfolio.
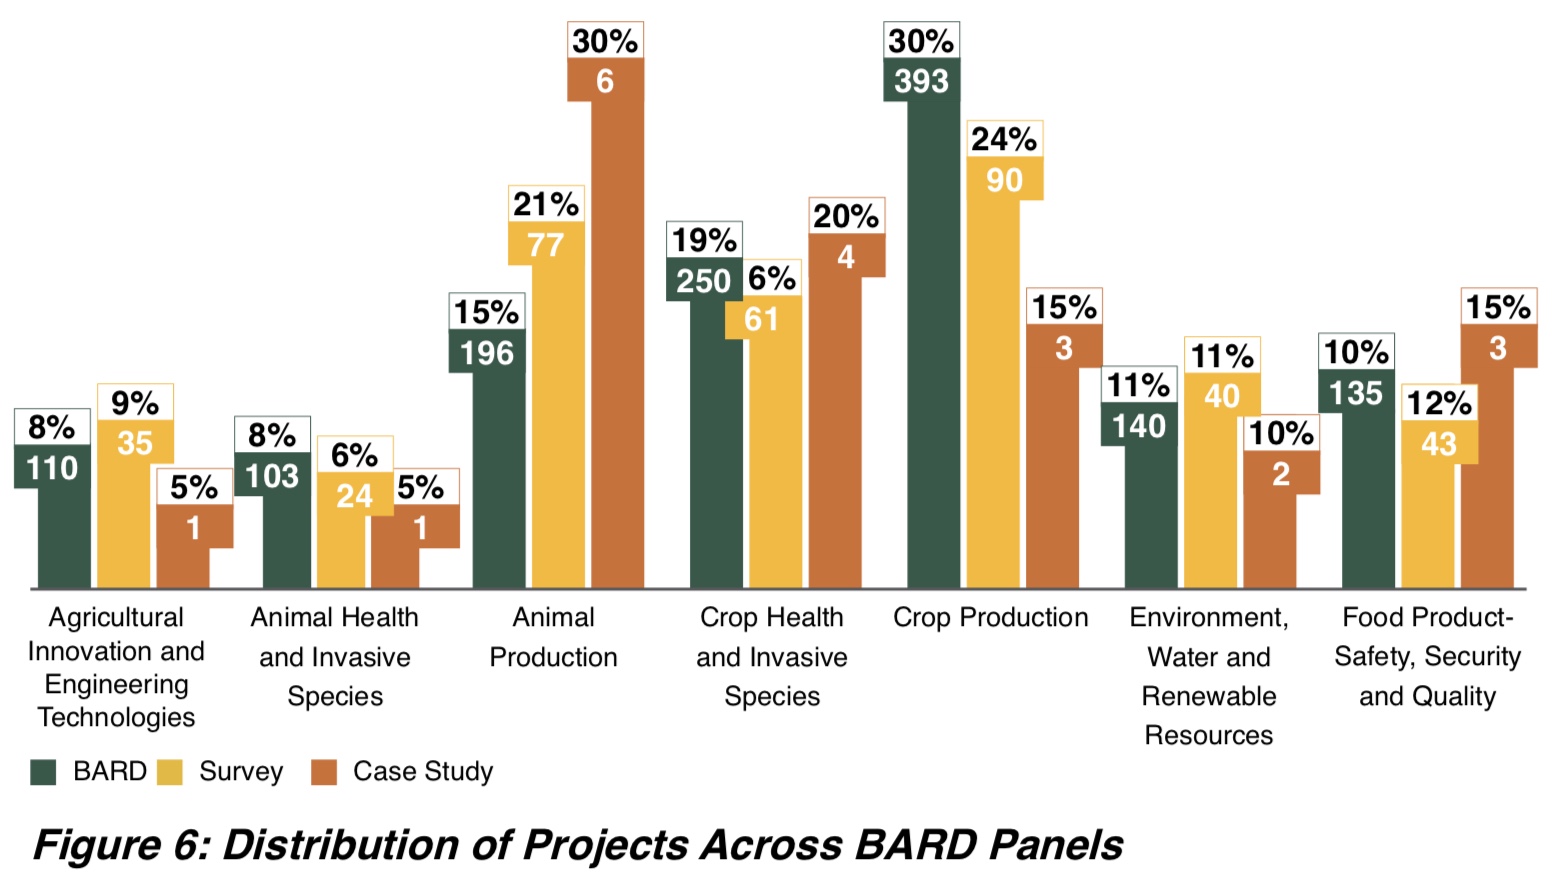
The project “GOSSYM Cotton Model” is classed under Crop Production in the BARD documentation but has since been transferred to the more suitable Environment, Water and Renewable Resources.
5.2.1 Evaluation of BARD’s Impact Derived from the Survey
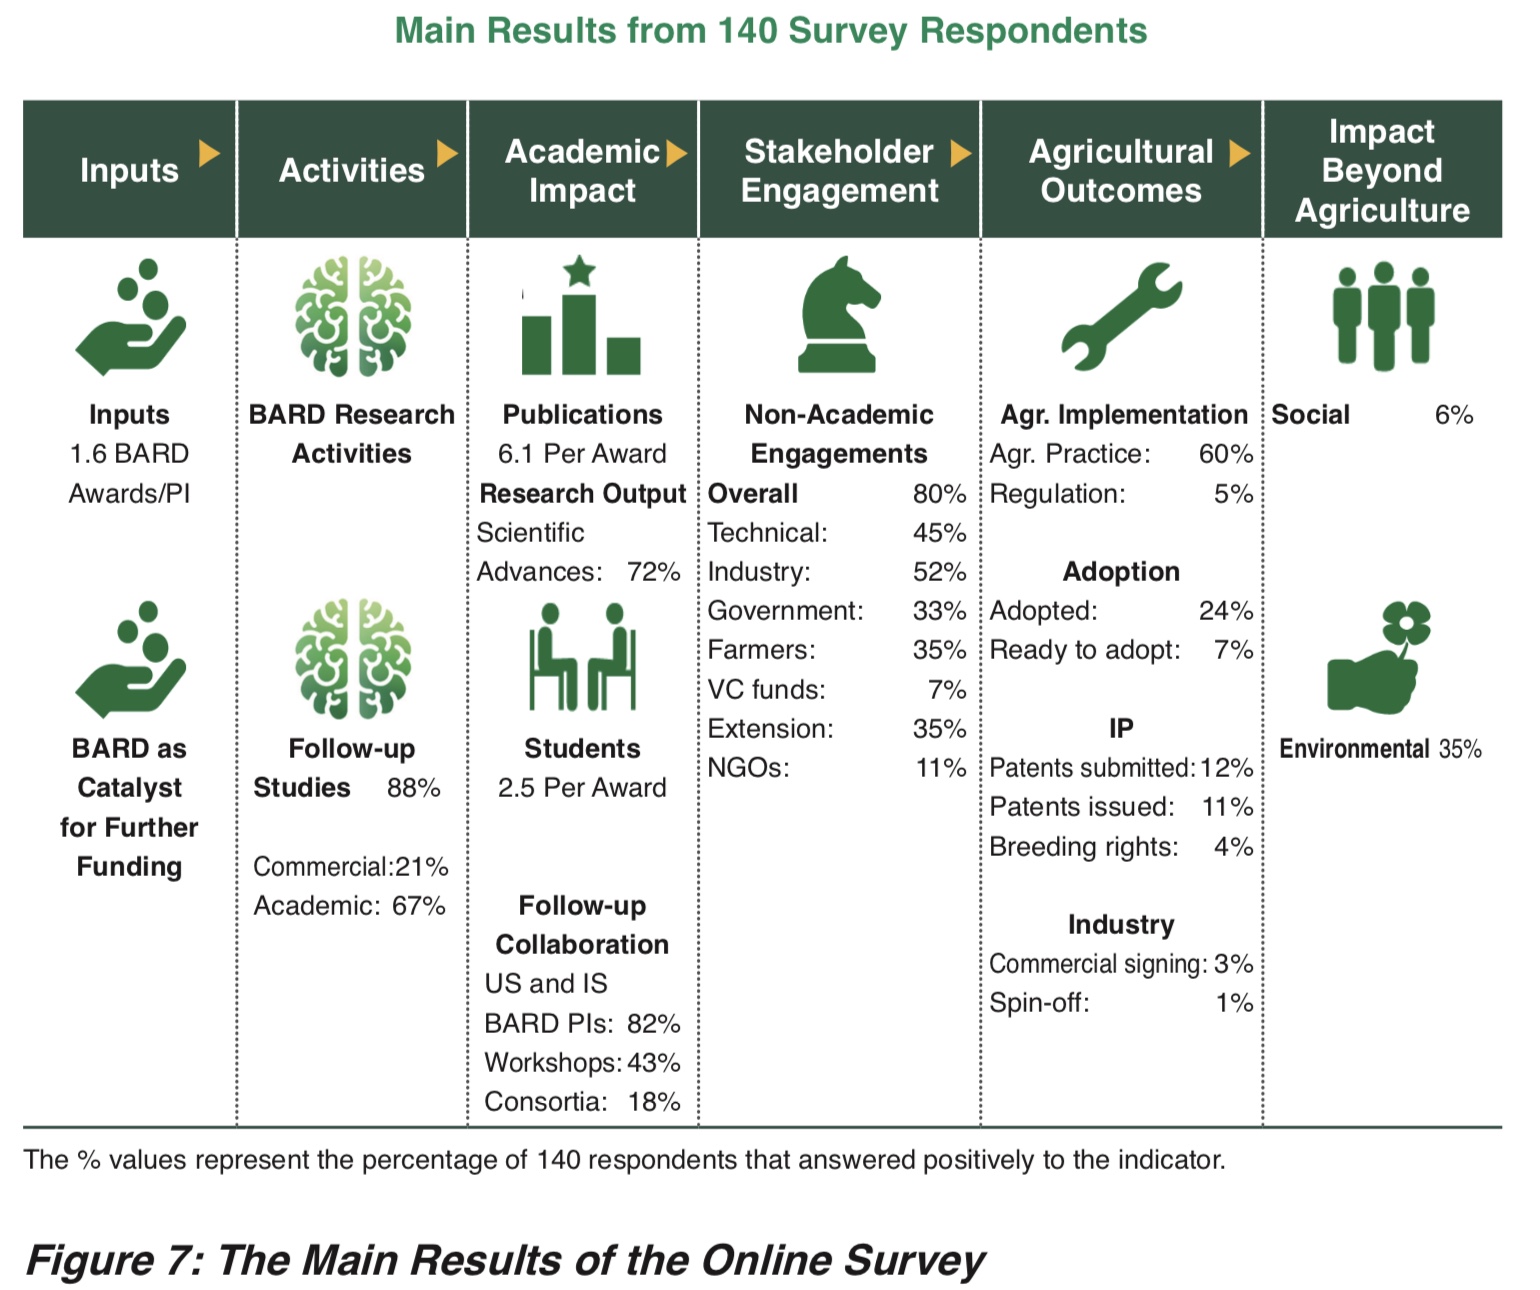
Over the 40 years of its activity, BARD has funded 1,330 research awards involving a total of 1,540 PIs, 910 from the US and 630 from Israel. The self-reporting online questionnaire was circulated to 640 US and Israeli PIs on awards received in the period of 1994–2014. The PIs were asked to respond on a single award, or on multiple awards related to a single research project that they regarded as their most impactful. A total of 140 PIs completed the survey, 66 from the US and 74 from Israel, relating in their answers to 224 BARD awards. Of the respondents, 18 US-Israeli pairs reported on the same awards. The main results of the survey are presented in Figure 7 and are described in brief according to the pathway of the research from initial input to final impact.
5.2.2 Inputs
- Research projects are often comprised of multiple awards. The average number of awards per project among the survey respondents was 1.6. From this we calculated that a total of 830 research projects emerged from the 1,330 granted awards. This estimate is used later in the analysis.
- The overwhelming majority of researchers, 88%, continued research on the topic of their BARD project after termination of the award.
- A solid majority, 67% of the respondents, reported that the BARD grant facilitated further funding via BARD and other academic funding programs, and another 21% reported securing continued funding from commercial entities.
5.2.3 Academic Impact and Capacity Building
- To date, the 1,330 awards funded by BARD have generated more than 5,600 published manuscripts. These were an outcome of approximately 925 awards, or 70% of all awards, which yielded an average of 6.1 publications per project. This figure is a low estimate, as data on publications from the early years of BARD (chiefly the 1980s) is incomplete, and not all researchers maintain updated records of their BARD-associated publications.
- 10% of the publications have over 100 citations, and 42% appeared in the first quartile (Q1) journals, i.e. those with an impact factor that ranks in the top 25% of journals in their particular research discipline.
- On average, 2.5 graduate students participated in the research for each award. Currently, 40% of the students and postdoctoral researchers are in academia and 22% hold positions in Agri- and Bio- industries. These figures represent the lowest estimate, as in several cases PIs were unable to provide information about the students’ current occupation.
- 72% of respondents reported that significant scientific advances were achieved during the research. 43% participated in academic workshops and 18% in consortia on the topic of their BARD research.
- 82% of all respondents continued to collaborate with their US or Israeli Co-PI in subsequent follow-up studies.
5.2.4 Stakeholder Engagement
- More than 80% of the respondents participated in sharing of their findings with non-academic stakeholders. Many respondents engaged with more than one stakeholder category (see Figure 7).
5.2.5 Practical Agricultural Outcome
- 65% of the respondents reported that the research project had practical implications for agricultural practice and policies.
- 24% of the respondents reported that their research output had already been adopted; another 7% reported that their findings were ready for adoption.
- 12% of the respondents applied for patent registration, of which 11% have been issued patents. 4% have been assigned breeding rights, 3% have signed commercial agreements related to the BARD-funded research outcomes, and 1% founded a spin-off company based on the BARD-funded research output.
5.2.6 The Selected Case Studies
The 20 selected case studies are listed in Table 4.
The projects are listed within their respective BARD panel in chronological order of the years of research activity.
|
Table 4: 20 Selected Case Studies for In-Depth Analysis |
||||
Subject |
PIs |
# Awards |
Time Span of Awards |
|
Crop Production |
||||
|
1 |
Magical Nebula |
A. Schaffer (ARO), M. Pharr (NC State U), A. Bennett (UC Davis) |
5 |
1987-1997 |
|
2 |
High Brix Tomatoes |
S.D. Tanksley (Cornell U.), D. Zamir (HUJI) |
4 |
1995-2002 |
|
3 |
Power Wheat |
J. Dubcovsky (UC Davis), T. Fahima (Haifa U.), A. Blechl (USDA), P. San Miguel (Purdue U.) |
5 |
2001-2016 |
Animal Production |
||||
|
4 |
Chicken Feed |
S. Hurwitz (ARO), J.P. McMurtry (USDA), H. Talpaz (ARO) |
2 |
1984-1990 |
|
5 |
Sheep Prolificacy |
E. Gootwine (ARO), W. C. Foote (Utah U.), D. Thomas (Wisconsin U.) |
3 |
1985-1993 |
|
6 |
Genetic Improvement of Dairy Herd |
J. I. Weller, M. Ron, E. Seroussi (ARO), D. Gianola, H. A. Lewin (Illinois U.), G. R. Wiggans, P. M. VanRaden (USDA), I. Misztal (Georgia U.) |
6 |
1985-2018 |
|
7 |
Hatchery Spawning |
Y. Zohar (IOLR), Y. Koch (Weizmann Inst.), R.S. Langer (MIT), W.W. Dickhoff (Washington U.) |
2 |
1985-2002 |
|
8 |
In-ovo Feeding |
Z. Uni (HUJI), P.R. Ferket (NCSU), E. A Wong (Virginia Tech) |
3 |
2002-2018 |
|
9 |
Monosex Prawns |
A. Sagi (BGU), A. Elizur, (Dept. of Ag. & Fisheries. Queensland), S. Du, Y. Zohar (UMD) |
2 |
2006-2015 |
Animal Health & Invasive Species |
||||
|
10 |
Tilapia Virus |
W. I. Lipkin (Columbia U.), E. Bacharach (TAU), A. Eldar (Isr. Vet. Institute) |
2 |
2013-2019 |
Food Product – Safety, Security & Quality |
||||
|
11 |
Ornamental Foliage |
R.T. Poole, C.A. Conover (Florida U.), J. Ben-Jaakov (ARO) |
1 |
1980-1983 |
|
12 |
Biocontrol Agents |
C.L. Wilson, W.J. Janisiewicz, M. Wisniewski (USDA), E. Chalutz, S. Droby (ARO) |
5 |
1985-2003 |
|
13 |
Mango Treatment |
D. Prusky (ARO), N. Keen (UC Riverside), J. Rollins (Florida U.), L. Vaillancourt (Kentucky U.), T. Mengiste (Purdue U.), R. Fluhr (Weizmann Inst.) |
5 |
1995-2014 |
Crop Health & Invasive Species |
||||
|
14 |
Trichoderma Biocontrol |
R.D. Baker (Colorado St. U.) G.E Harman (Cornell U.), I. Chet (HUJI) |
8 |
1981-2004 |
|
15 |
Bombus for Crop Pollination |
A. Hefetz (TAU), G.E. Robinson (Illinois U.), J.O. Schmidt (USDA), S.L. Buchmann (Arizona U.) |
2 |
1994-2002 |
|
16 |
Citrus Greening Immunity |
M. Bar-Joseph (ARO), R.F. Lee, W. Dawson (Florida U.) |
4 |
1994-2006 |
|
17 |
Basil Resistance |
J.E. Simon (Rutgers), Y. Cohen (Bar-Ilan U) |
1 |
2016-2019 |
Environment, Water & Renewable Resources |
||||
|
18 |
GOSSYM Cotton Model |
D. Baker (USDA), A. Marani (HUJI) |
1 |
1981-1984 |
|
19 |
Aquaculture Waste Treatment |
K. Sowers, Y. Tal (UMD), A. Gross (BGU) |
2 |
2004-2014 |
Agricultural Innovation & Engineering Technologies |
||||
|
20 |
Robotic Stress Detection |
S. Nof (Purdue U) Y. Tao (UMD), A. Bechar (ARO) |
1 |
2016-2019 |
5.2.7 Main Economic Outcomes of the Selected Case Studies
The results are expressed in 2018 discounted dollar-terms, unless otherwise stated.
Appendix 1 showcases the 20 projects chosen as case studies, with summaries outlining the main outcomes of each. The more detailed analysis of each project appears in the Evaluation Compendium. BARD awarded. 64 grants across the 20 case studies totaling $49 million in 2018 dollar-terms, with an average of 3.2 grants per project. The summaries include BARD’s share in the total investment required for
research and development, and its share of the attributed benefit. The 20 case studies produced 502 publications, an average of 25 publications per project and 7.8 per grant. A total of 128 graduate students and postdoctoral fellows were involved in the research, an average of 6 students per project and 2 per grant. From Table 5, it can be concluded that, on average, a successful case study would need 3.2 grants to reach implementation or commercialization, yield 25 publications and employ 6.25 postgraduate students.
|
Table 5: 20 Selected Case Studies: Capacity Building & Investment |
|||||||||
|
# |
The Research |
Capacity Building |
Investment |
|
|||||
|
Publications |
Students involved |
# Awards |
Years |
BARD ($M) |
Further funding ($M) |
BARD funding share (%) |
Benefit attributed to BARD (%) |
||
|
1 |
Magical Nebula |
26 |
12 |
5 |
1987-1997 |
4.8 |
9.1 |
34 |
49 |
|
2 |
High Brix Tomatoes |
33 |
5 |
4 |
1995-2001 |
3.6 |
6.4 |
36 |
51 |
|
3 |
Power Wheat |
28 |
20 |
5 |
2001-2016 |
2.4 |
1.2 |
67 |
67 |
|
4 |
Chicken Feed |
19 |
2 |
2 |
1984-1990 |
1.9 |
6.3 |
23 |
38 |
|
5 |
Sheep Prolificacy |
17 |
1 |
3 |
1985-1993 |
3.2 |
0.3 |
90 |
90 |
|
6 |
Genetic Improvement of Dairy Herd |
79 |
15 |
6 |
1985-2017 |
4.3 |
NA |
NA |
4 |
|
7 |
Hatchery Spawning |
30 |
3 |
2 |
1985-1991 |
2 |
NA |
NA |
40 |
|
8 |
In-ovo Feeding |
13 |
5 |
3 |
2002-2018 |
1.0 |
Too early to determine |
||
|
9 |
Monosex Prawns |
12 |
7 |
2 |
2006-2014 |
0.8 |
1.3 |
37 |
52 |
|
10 |
Tilapia Virus |
4 |
3 |
2 |
2013-2018 |
0.5 |
2.0 |
20 |
22 |
|
11 |
Ornamental Foliage |
7 |
NA |
1 |
1980-1982 |
1.3 |
0.0 |
100 |
75 |
|
12 |
Biocontrol Agents |
56 |
9 |
5 |
1985-2003 |
3.7 |
4.2 |
46 |
61 |
|
13 |
Mango Treatment |
41 |
9 |
5 |
1995-2013 |
3.3 |
0.6 |
86 |
89 |
|
14 |
Trichoderma Biocontrol |
50 |
7 |
8 |
1981-2007 |
8 |
37 |
17 |
32 |
|
15 |
Bombus for Crop Pollination |
5 |
4 |
2 |
1994-2001 |
1.5 |
0 |
100 |
Non-monetary benefits |
|
16 |
Citrus Greening Immunity |
66 |
11 |
4 |
1994-2006 |
3.0 |
Too early to determine |
||
|
17 |
Basil Resistance |
3 |
5 |
1 |
2016-2018 |
0.3 |
0.5 |
37 |
37 |
|
18 |
GOSSYM Cotton Model |
2 |
2 |
1 |
1981-1984 |
2.8 |
NA |
NA |
25 |
|
19 |
Aquaculture Waste Treatment |
4 |
4 |
2 |
2004-2014 |
1 |
3 |
20 |
20 |
|
20 |
Robotic Stress Detection |
7 |
4 |
1 |
2016-2019 |
0.4 |
Too early to determine |
||
|
|
TOTAL |
502 |
128 |
64 |
|
49.8 |
|
|
|
NA – information not available
Table 6 presents the results of the economic analysis for each case study, calculated both to the present, i.e. 2018, as well as projected until 2028. The analyses show that approximately 60% of the Net Present Value (NPV) has already been attained. Four case studies have not yet achieved a positive NPV. Of these, 3 are promising projects expected to yield high results, but it is too early to evaluate the benefit (case studies 8, 16 and 20). Additionally, case study 15 has indirect benefits that are outside the scope of our evaluation methodology.
Table 6 shows the distribution of the benefit between three entities: the US, Israel and Other Countries. The allocation is calculated according to the location of the agricultural implementation and of the consumption of the produce.
|
Table 6: 20 Selected Case Studies: Main Economic Results |
||||||||||||
|
|
|
NPV Attributed to BARD Projected to 2028 |
NPV Attributed to BARD Already Attained |
|
Allocation of the NPV |
|||||||
|
|
Research
|
NPV $M |
IRR (%) |
BCR |
NPV $M |
IRR (%) |
BCR |
Lag |
US |
IS |
Other |
Total |
|
1 |
Magical Nebula |
220 |
16% |
47 |
24 |
10% |
6 |
28 |
2 |
-2 |
221 |
220 |
|
2 |
High Brix Tomatoes |
261 |
28% |
74 |
166 |
28% |
48 |
14 |
263 |
-2 |
0 |
261 |
|
3 |
Power Wheat |
118 |
32% |
50 |
20 |
27% |
9 |
12 |
37 |
-1 |
82 |
118 |
|
4 |
Chicken Feed |
788 |
28% |
410 |
382 |
28% |
199 |
12 |
168 |
3 |
617 |
788 |
|
5 |
Sheep Prolificacy |
204 |
18% |
65 |
76 |
16% |
25 |
19 |
-2 |
206 |
0 |
204 |
|
6 |
Genetic Improvement of Dairy Herd |
1,135 |
25% |
264 |
248 |
22% |
59 |
25 |
534 |
2 |
599 |
1,135 |
|
7 |
Hatchery Spawning |
12,050 |
143% |
5,883 |
7,522 |
143% |
3,673 |
6 |
156 |
240 |
11,654 |
12,050 |
|
8 |
In-ovo Feeding |
-1 |
Too early to determine |
-0.5 |
-0.5 |
0 |
-1 |
|||||
|
9 |
Monosex Prawns |
38 |
21% |
51 |
4 |
14% |
6 |
26 |
0 |
0 |
38 |
38 |
|
10 |
Tilapia Virus |
46 |
83% |
91 |
1 |
47% |
3 |
4 |
2 |
1 |
43 |
46 |
|
11 |
Ornamental Foliage |
119 |
89% |
90 |
119 |
89% |
90 |
5 |
119 |
-1 |
0 |
119 |
|
12 |
Biocontrol Agents |
12 |
9% |
4 |
12 |
9% |
4 |
33 |
6 |
-2 |
8 |
12 |
|
13 |
Mango Treatment |
54 |
21% |
17 |
26 |
20% |
9 |
15 |
6 |
29 |
19 |
54 |
|
14 |
Trichoderma Biocontrol |
647 |
17% |
85 |
190 |
15% |
26 |
17 |
618 |
-4 |
33 |
647 |
|
15 |
Bombus Crop Pollination |
-1.5 |
Indirect benefits not calculated |
-0.7 |
-0.7 |
0 |
-1.5 |
|||||
|
16 |
Citrus Greening Immunity |
-3 |
Too early to determine |
-1.5 |
-1.5 |
0 |
-3 |
|||||
|
17 |
Basil Resistance |
10 |
144% |
34 |
0 |
56% |
2 |
2 |
4 |
4 |
3 |
10 |
|
18 |
GOSSYM Cotton Model |
813 |
98% |
288 |
813 |
98% |
288 |
5 |
766 |
47 |
0 |
813 |
|
19 |
Aquaculture Waste Treatment |
28 |
31% |
44 |
0 |
9% |
2 |
14 |
6 |
0 |
22 |
28 |
|
20 |
Robotic Stress Detection |
Too early to determine |
||||||||||
|
|
Total |
16,538 |
|
340 |
9,603 |
|
198 |
15 |
2,683 |
517 |
13,337 |
16,538 |
NPV = Net Present Value
IRR = Internal Rate of Return
BCR = Benefit-Cost Ratio
The lag column in Table 6 represents the time between the first year of BARD’s investment to the first practical application of the research outcomes. This varies between case studies, ranging from 2 to 33 years, with an average time lag of 15 years.
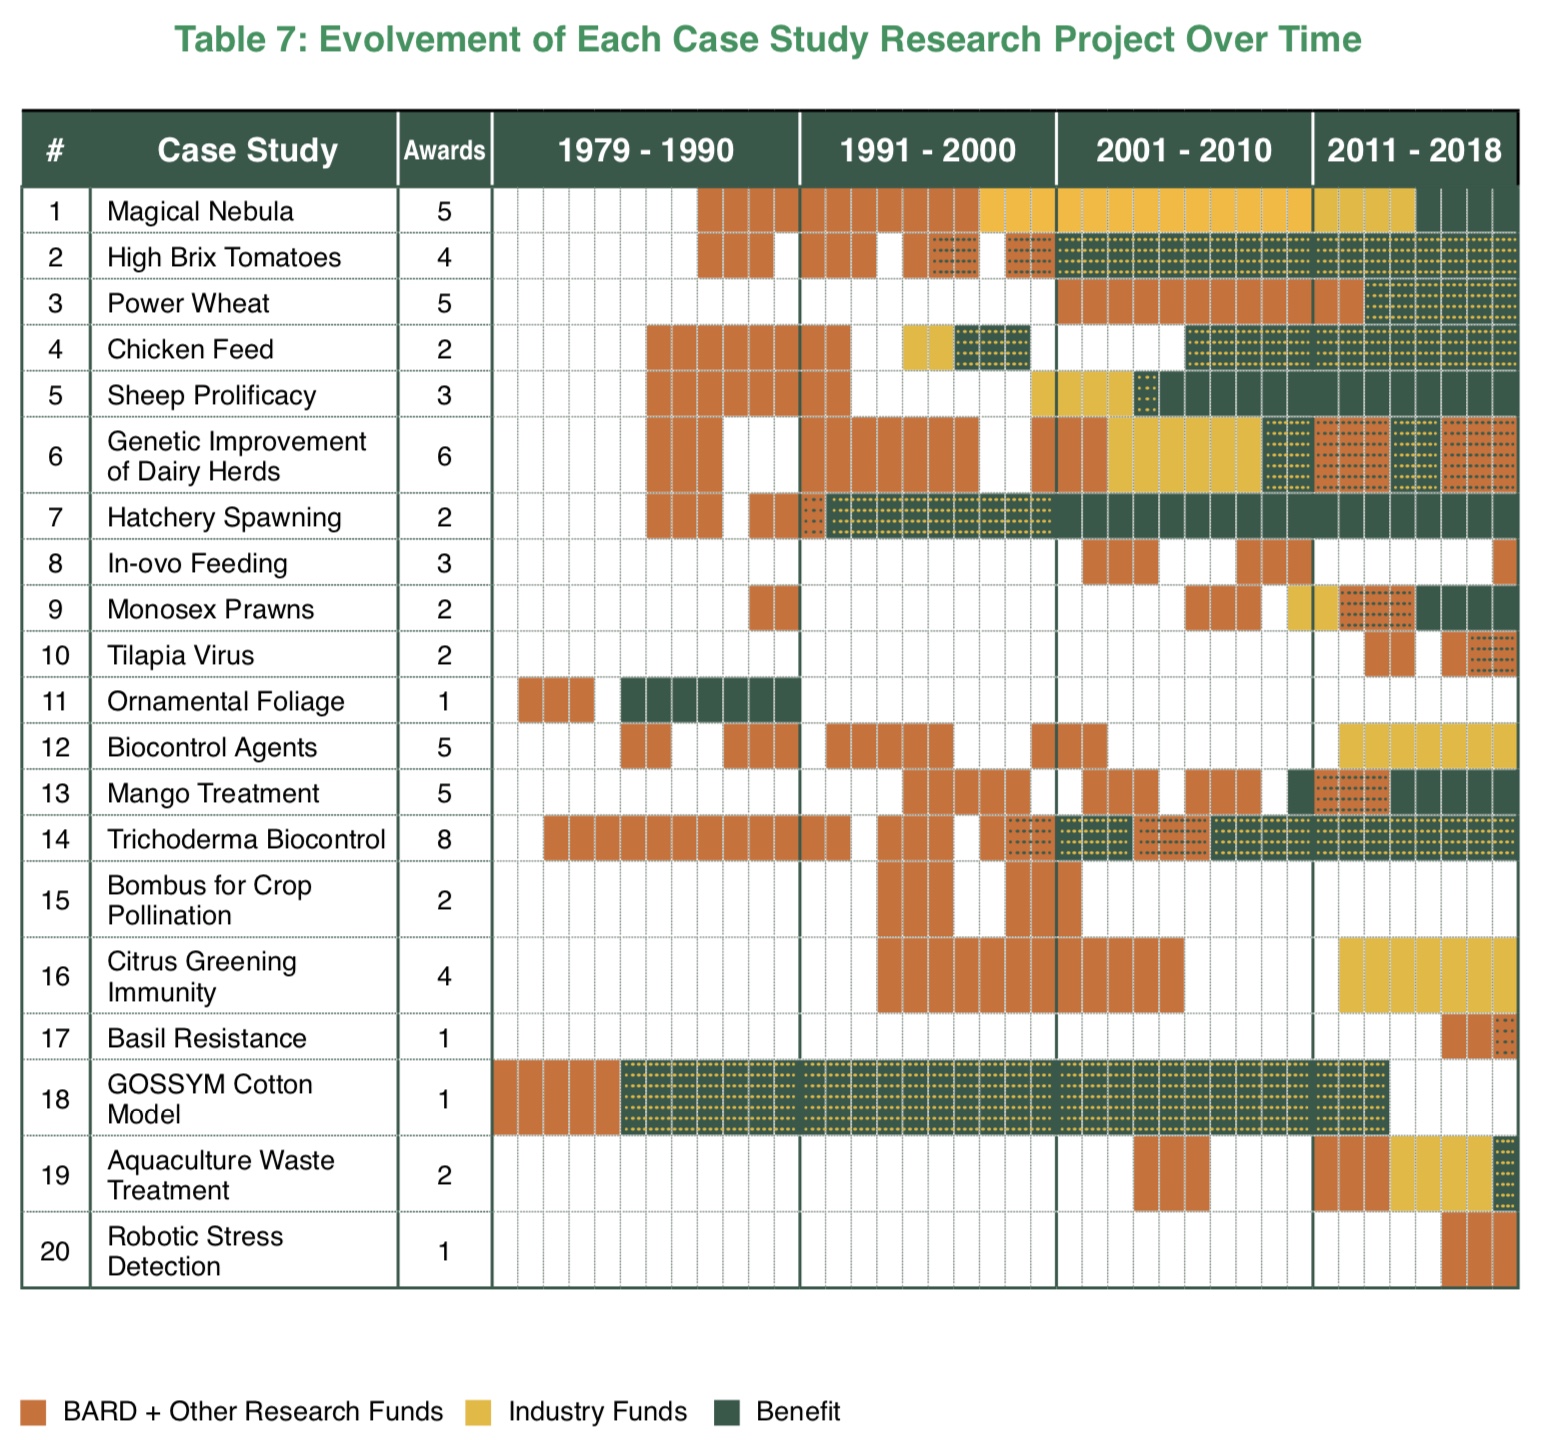
Table 7 details the evolvement of each case study project over time, illustrating the time span for the initial academic research, industry investments, and the ensuing benefit yielding implementation. The red cells represent research grant funding by BARD; yellow cells represent industry funding; green cells represent the benefits derived from the projects. In several cases, there is overlap between funding sources and the yield of benefits. These are marked as either red and yellow, or green and yellow, depending on the particular project’s progress.
This table shows that an average project needs numerous awards during its lifespan. Slightly more than half (53%) of the successful projects have a hiatus between granted BARD awards. This hiatus can slow or even prevent progress on the project and its implementation through engagement of commercial entities. It can be noted that two-thirds of the projects that have engaged with commercial entities began this engagement at least 9 years prior to commercialization.
5.2.8 The Growth in Benefits over Time
The US
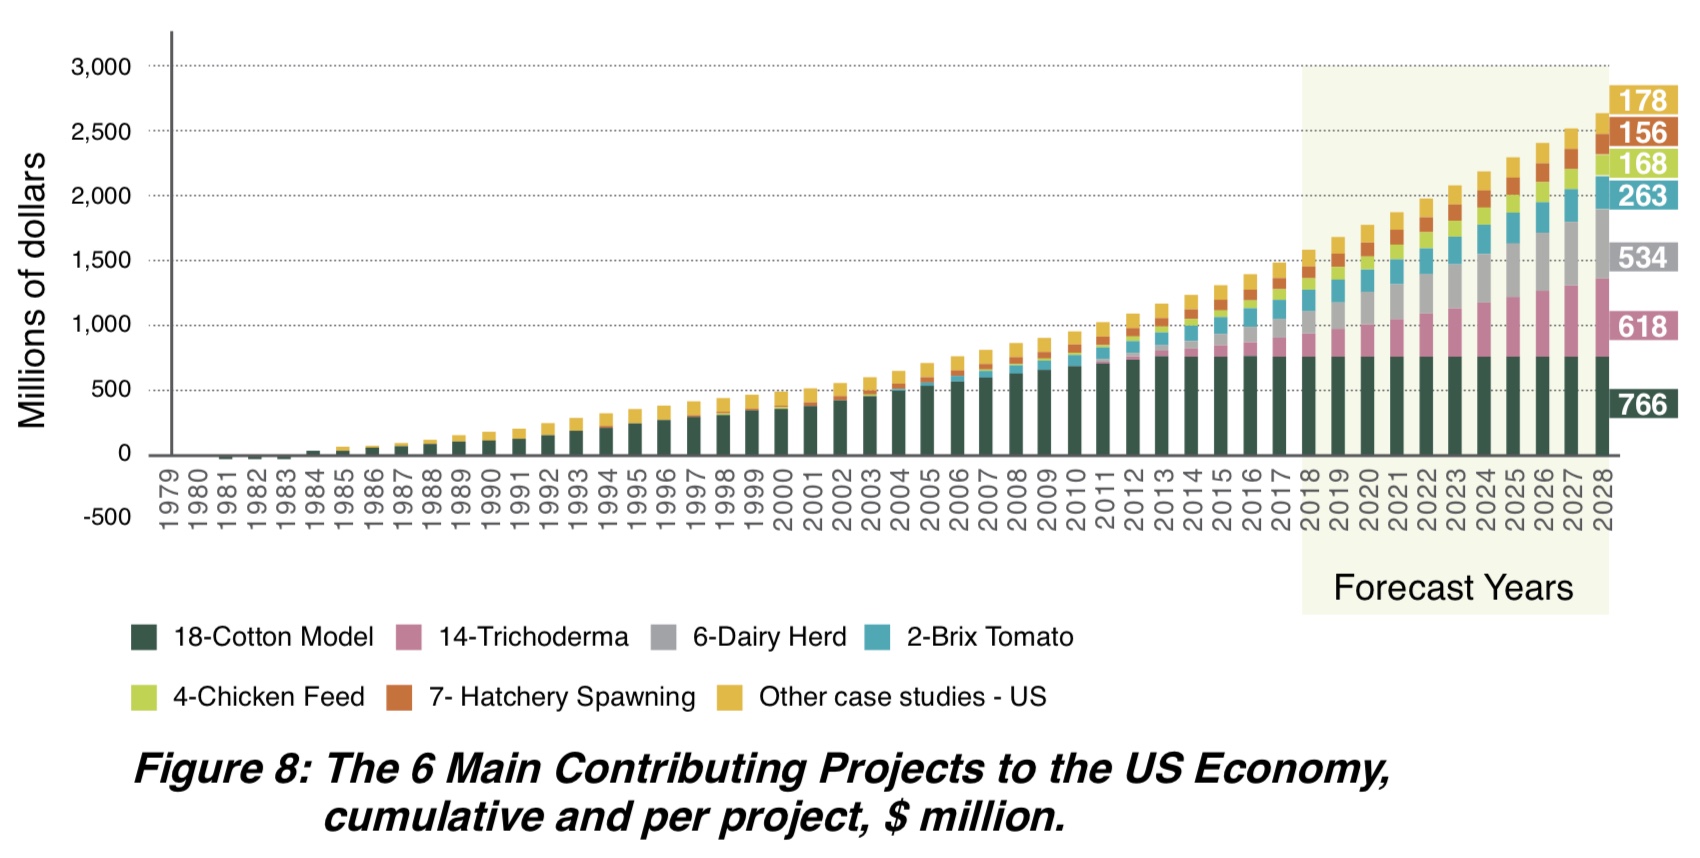
The total estimated benefit to the US economy is $2.7 billion, thereof 60% already attained in 2018. Six case studies contributed over 90% of the benefits to the US economy that emerged from the 20 case studies, as detailed below and illustrated in Figure 8:
- Cotton Model, case study 18: Estimated contribution of $766 million between 1984 – 2013.
- Trichoderma, case study 14: Anticipated contribution of $618 million between 2010 – 2028.
- Dairy Herd, case study 6: Anticipated contribution of $534 million between 2011 – 2028.
- Brix Tomatoes, case study 2: Anticipated contribution of $263 million between 2004 – 2028.
- Chicken Feed, case study 4: Anticipated contribution of $168 million between 2009 – 2028.
- Hatchery Spawning, case study 7: Anticipated contribution of $156 million between 1990 – 2028.
- All the other case studies contributed together $178 million.
Israel
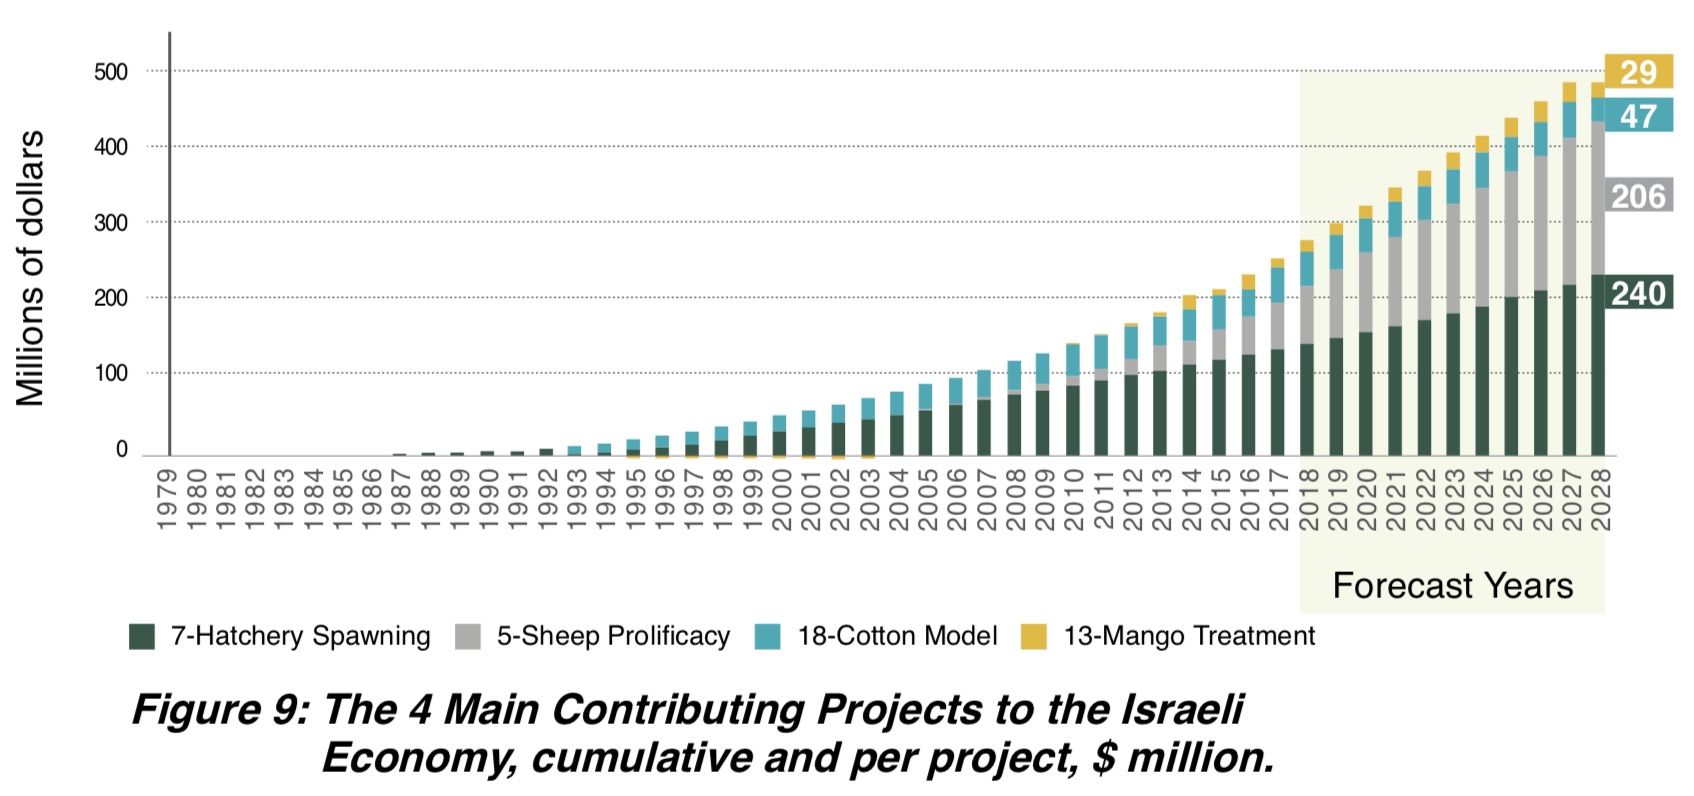
- The total estimated benefit to the Israeli economy is $0.5 billion, thereof 53% already attained in 2018. Four case studies contributed almost all the benefits to the Israeli economy that emerged from the 20 case studies, as detailed below and illustrated in Figure 9:
- Hatchery Spawning, case study 7: Anticipated contribution of $240 million between 1990 – 2028.
- Sheep Prolificacy, case study 5: Anticipated contribution of $206 million between 2006 – 2028.
- Cotton Model, case study 18: Estimated contribution of $47 million between 1984 – 2013.
- Mango Treatment, case study 13: Anticipated contribution of $29 million between 2010 – 2028.
Other Countries
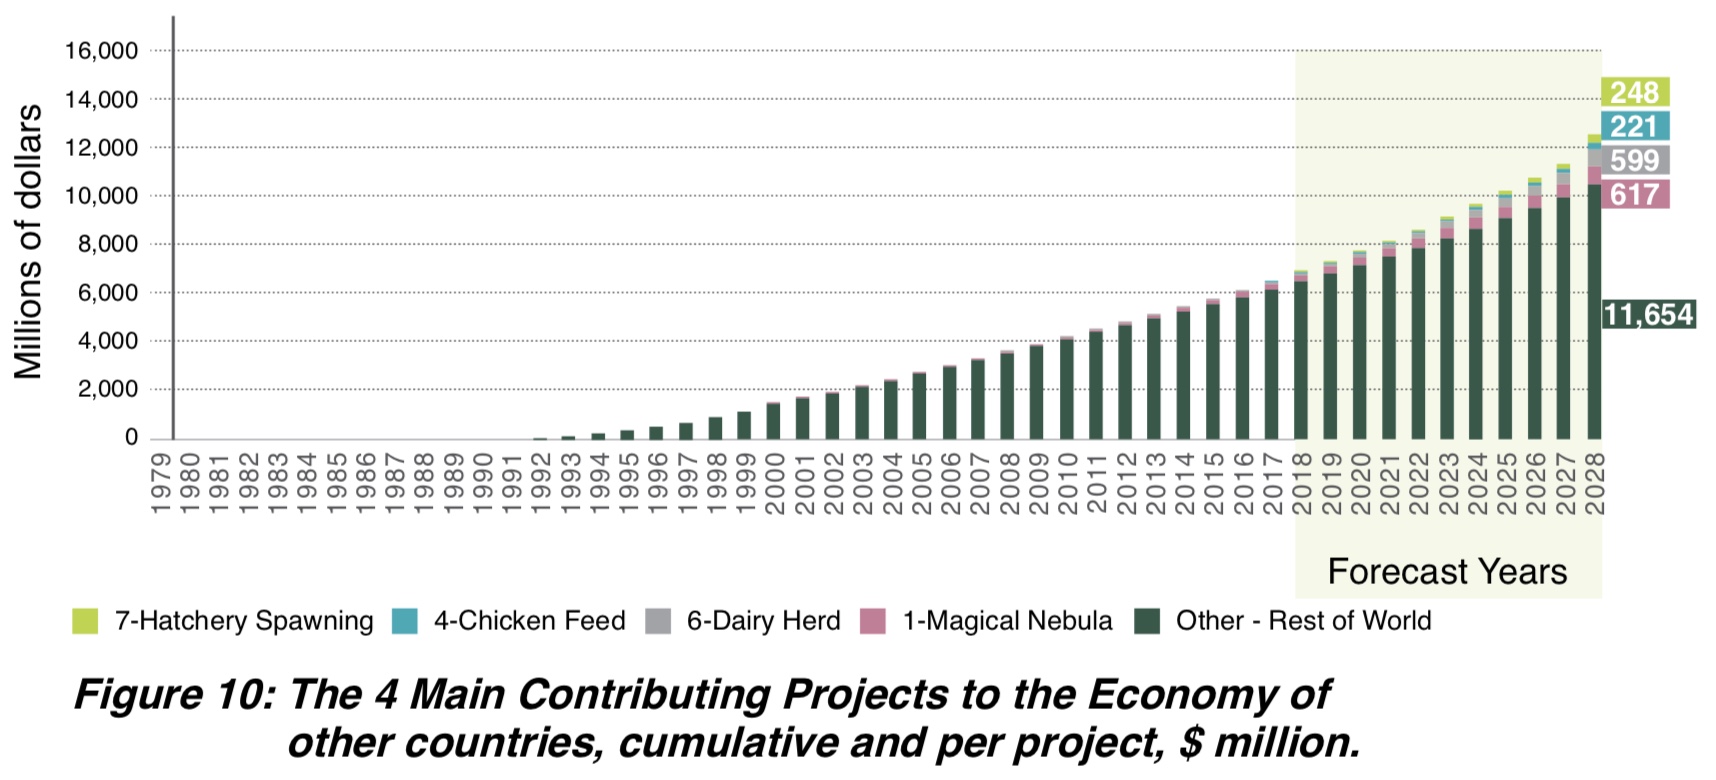
- The total estimated benefit to the economy of countries other than the US and Israel is $13.3 billion, thereof 58% already attained in 2018. Four case studies contributed over 95% of the benefits to the other countries’ economy that emerged of the 20 case studies, as detailed below and illustrated in Figure 10:
- Hatchery Spawning, case study 7: Anticipated contribution of $11.6 billion between 1990 – 2028.
- Chicken Feed, case study 4: Anticipated contribution of $617 million between 2009 – 2028.
- Dairy Herd, case study 6: Anticipated contribution of $599 million between 2011 – 2028.
- Magical Nebula, case study 1: Anticipated contribution of $221 million between 2017 – 2028.
- All the other case studies contributed together $248 million.
____________________
1. On the influence of that observation on the way to calculate the IRR indicator, see Alston et al
However, we used a simple IRR